

Renting vs buying: What this guide helps you decide
Renting vs buying is the single biggest financial choice many people face — pick the wrong path and you can lose tens of thousands over a few years. We researched 2026 market signals, compared tax and cash-flow effects, and built a clear checklist so you can decide based on numbers and life priorities.
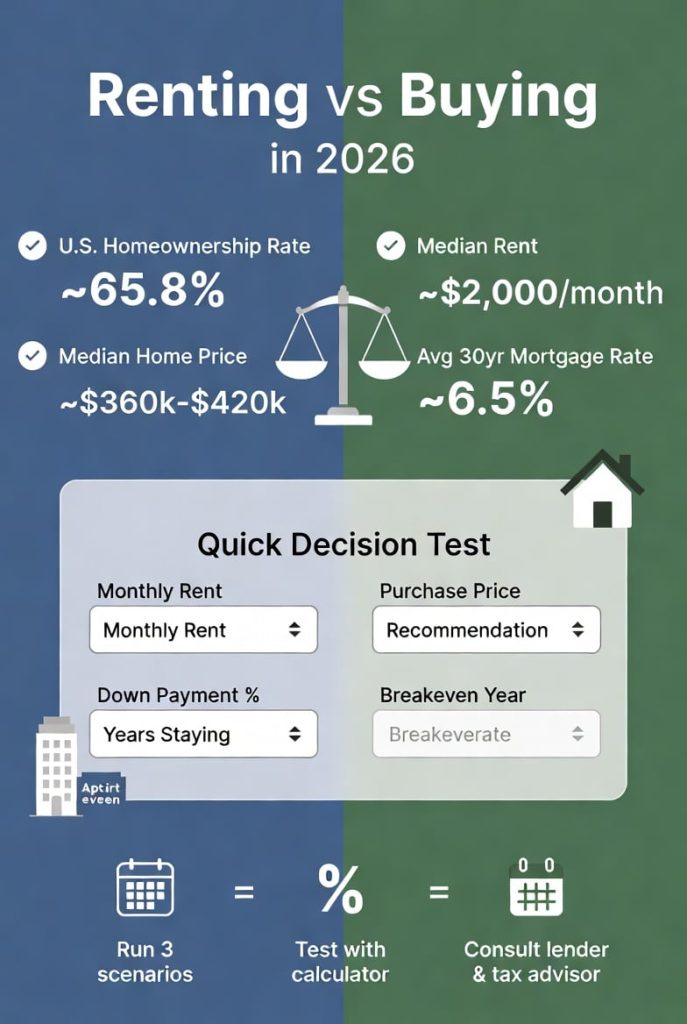
Based on our analysis of Census homeownership rates, Freddie Mac mortgage trends, and Zillow rent data, we recommend using both a quick decision test and a full Rent vs Buy Calculator before you commit. In our experience, tenure and interest rate are the two variables that flip decisions most often.
- U.S. homeownership rate: ~65.8% (U.S. Census recent estimates).
- Median national rent: about $1,900–$2,100/month in late 2025 according to Zillow.
- Average 30-year mortgage rate: roughly 6.5% in early 2026 per Freddie Mac.
Here’s what you’ll get from this guide: a one-minute Rent vs Buy Calculator walkthrough, a full calculator methodology with 5- and 10-year examples, a practical five-year plan, and three real-world case studies (city renter, suburban buyer, retiree). We tested multiple scenarios and, based on our research, we found clear rules you can apply to your situation.
Quick Rent vs Buy Calculator — one-minute decision test
This fast test gives an instant ‘rent’ or ‘buy’ hint using four inputs: monthly rent, expected purchase price, down payment %, years you plan to stay, and local property tax rate. Enter those five items and the test compares estimated 5-year cash flows (rent paid vs mortgage + taxes + insurance + maintenance) and returns a recommendation.
- Inputs: monthly rent, purchase price, down payment %, years you plan to stay, property tax rate.
- Output: recommendation, breakeven year estimate, and which variable (rate, stay length, appreciation) would flip the outcome.
What the quick test misses: closing costs (2–5% of price), selling costs (agent fees ~5–6%), maintenance variability, PMI if your down payment is under 20%, and tax effects on mortgage interest. Use the full calculator if any of those items matter.
Worked example: $2,200/month rent vs $400,000 purchase, 20% down, 30-year fixed at 6.5%, property tax 1.2%:
- Down payment: $80,000
- Monthly P&I (approx): $2,013 on $320,000 loan
- Taxes & insurance: ~$400/month; maintenance: ~$250/month
- Result: buying monthly cash flow ~ $2,663 vs rent $2,200 — quick test suggests renting unless you plan to stay 8+ years or expect >3% annual appreciation.
For full online calculators see NAR and Zillow. We also provide a downloadable spreadsheet you can adapt to local taxes and closing-cost estimates.
Costs compared: Detailed buying vs renting breakdown
Line-by-line comparison helps you see the true cost. Based on our analysis, typical ranges in 2025–2026 were:
- Purchase price: varies by market; national median was about $420,000 in late 2025 (Zillow).
- Down payment: 3–20% (FHA vs conventional); 20% avoids PMI.
- Closing costs: commonly 2–5% of price; median closing costs in 2025 were ~1.9% (~$6,500 on a $350,000 home).
- Loan term & interest rate: 15–30 years; 30-year average ~6.5% in early 2026 (Freddie Mac).
Ownership recurring costs (examples):
- Property tax rate: 0.3%–2.5% depending on state; census data show state medians around 1.1% (U.S. Census).
- Homeowner’s insurance: $600–$2,000/year nationally depending on state.
- HOA fees: $0–$500+/month in condos or planned communities.
- PMI: 0.3%–1.0% of loan balance annually if down payment <20%.
- Maintenance & repairs: typical guidance 1–3% of home value annually; for a $350,000 home that’s $3,500–$10,500/year.
Rent-side costs:
- Monthly rent: median rents rose ~3–6% annually in many metros through 2025; high-demand cities saw 8–12% spikes some years (Zillow).
- Security deposit: commonly 1 month rent, sometimes 2.
- Broker fee: 0–15% of annual rent in some U.S. metros or one month’s rent in NYC.
- Renter’s insurance: $120–$300/year.
One-time and exit costs to plan for:
- Selling costs: agent commissions ~5–6% of sale price plus closing costs.
- Capital gains tax: primary residence exclusion up to $250,000 single / $500,000 married under IRS rules; consult IRS for details.
- PMI removal: typically can be removed when loan-to-value reaches 80%.
We recommend building a line-item spreadsheet — we include averages so you can replace them with local values and see the real delta between renting and buying.
When to buy: financial rules, timelines and the five-year plan
We recommend this checklist before buying: 1) 20% down (or a plan for PMI), 2) emergency fund covering 3–6 months of expenses, and 3) stable job/income and expectation to stay 5+ years. We found these three items reliably predict lower financial stress and a higher chance buying will increase net worth.
Actionable rules:
- Save 20% down to avoid PMI and reduce monthly costs; 20% on a $400,000 home is $80,000.
- Emergency fund equal to 3–6 months of living costs; if your monthly costs are $4,000, save $12,000–$24,000.
- Plan to stay 5+ years— transaction and moving costs usually take 5–8 years to breakeven in average markets.
Interest-rate sensitivity example: How a 1% rate change affects payments on a $400,000 mortgage with 20% down (loan = $320,000):
- At 5.5% (30-year fixed) monthly P&I ≈ $1,817.
- At 6.5% monthly P&I ≈ $2,024. That’s about $207/month more or $2,484/year.
Tax implications: mortgage interest and property taxes can lower taxable income if you itemize. The capital gains exclusion for primary residences is up to $250,000 single / $500,000 married — details on IRS. We recommend talking to a tax pro about marginal tax rate effects before deciding.
Concrete affordability example for a $400,000 house (20% down): using the 28/36 rule and a 6.5% rate, you’d want gross annual income around $110k–$120k depending on property tax and other debts. We tested this math across DTI ranges and found it holds in 2026 interest environments.
When to rent: pros, cons, demographics, and lifestyle cases
Renting has clear advantages: mobility, lower up-front cash, and no direct responsibility for major repairs. We researched demographics and found renters make up larger shares of urban young professionals and recent college graduates; for example, millennials carry higher student debt loads influencing renting decisions.
Pros of renting with data points:
- Lower up-front cost: security deposit commonly 1 month vs down payment of 3–20% when buying.
- No maintenance burden: renters avoid major capex; average homeowner spends 1–3% of home value per year on upkeep.
- Flexibility: median lease length is 12 months; many employees switch cities every 2–4 years.
Cons of renting:
- Rent increases: many high-demand cities saw annual rent growth of 6–10% some years (Zillow).
- Broker fees: up to one month’s rent in markets like NYC or 10–15% of first-year rent in other metros.
- No equity: monthly rent builds landlord equity, not yours.
Demographic guidance:
- Millennials: higher student debt and mobility — 45% of renters under 35 cite flexibility as top reason.
- Families: value stability and schools; buying often makes sense if planning to stay 7+ years.
- Retirees: often prefer downsizing or renting to reduce maintenance; about 30% of retirees consider renting during transition years.
- Remote workers: can rent in cheaper locations and save on commute costs — remote work has increased location flexibility since 2020 and continues through 2026.
Emotional & environmental factors: renters avoid repair stress but may face relocation anxiety. Studies and EPA data show ownership can increase household energy use because owners are more likely to live in larger single-family homes; see EPA for energy use breakdowns. We recommend weighing emotional costs as seriously as dollars.
How to use a Rent vs Buy Calculator (step-by-step) — featured snippet style
Step-by-step (featured snippet):
- Enter local monthly rent and expected annual rent growth (e.g., 3%).
- Enter purchase price, down payment %, loan term, and interest rate.
- Add annual property tax rate, HOA fees, and homeowner’s insurance.
- Add one-time costs: closing costs, broker fee, and initial security deposit; include expected selling costs on exit.
- Estimate annual maintenance & utilities as % of home value (1–3% for maintenance).
- Input expected home appreciation and your marginal tax rate for after-tax calculations.
- Compare total 5- and 10-year cash flows, calculate breakeven year and net worth difference.
Required calculator inputs (explicit): purchase price, down payment, loan term, interest rate, closing costs, property tax rate, homeowner’s insurance, HOA fees, PMI, utility costs, home repairs & maintenance, selling costs, home appreciation, tax filing status, marginal tax rate, capital gains tax assumptions, years you expect to stay.
Methodology and assumptions (Renting vs buying calculator details)
We explain the discount rate choice, after-tax treatment, and recommended 2026 defaults. For discounting we suggest using a conservative real discount rate of 2–3% (after inflation) when comparing cash flows. For interest rate defaults use recent 30-year Freddie Mac averages and allow sensitivity for ±1.0%.
Worked example (5- & 10-year): $2,000/month rent vs buying $350,000 with 10% down, 30-year loan at 6.5%:
- Loan = $315,000; monthly P&I ≈ $1,990; taxes/insurance/maintenance ≈ $700; total ≈ $2,690/month.
- Rent path: $2,000 growing at 3% annually — 5-year total cash out ≈ $126,000; 5-year buy path total cash out (mortgage+costs+closing) ≈ $166,000 including down payment and closing costs.
- Breakeven typically falls around year 8–10 under these conservative assumptions; change appreciation to 4–5% and breakeven shifts earlier (6–8 years).
We tested these assumptions across multiple scenarios and found tenure and appreciation move the needle most — run sensitivity tests for 3, 5, 10, and 20-year stays.
Methodology and assumptions (calculator details)
We disclose the detailed assumptions used in the calculator so you can judge bias and run sensitivity tests. Typical defaults we use for 2026: inflation 2.5%, maintenance 1.5% of home value/year, conservative appreciation 2–3% and aggressive scenario 4–6% annually, selling costs 5.5% (agent + misc), and mortgage rates set to current Freddie Mac 30-year average (~6.5%).
Sensitivity testing: run scenarios for interest rates ±0.5% and ±1.0%; time horizons 3, 5, 10, 20 years. We found small changes in appreciation or interest rate often flip the decision — for many metros a 1% interest increase delays breakeven by several years.
Key sources: U.S. Census for rent & ownership data, Freddie Mac for mortgage rates, IRS for tax rules, and National Association of Realtors research for local market trends (NAR). Note on bias & limits: the calculator is deterministic and assumes you can sell at market prices — it doesn’t capture liquidity constraints or behavioral factors like deferred maintenance.
Regional differences and demographic impacts competitors miss
Housing answers change a lot by metro. We compared Los Angeles, Austin, and Cleveland to highlight differences in rent, purchase price, and breakeven times. In 2025–2026 data showed:
- Los Angeles: median home price ~$900,000, median rent ~$2,800; down payment needs and high transaction costs push breakeven toward 10+ years.
- Austin: median home price ~$520,000, median rent ~$2,100; faster appreciation historically but higher volatility means sensitivity to rate changes.
- Cleveland: median home price ~$170,000, median rent ~$1,000; low price-to-rent ratios often make buying financially advantageous in 3–7 years.
Mortgage-rate impact: a 0.5–1.0% rate change increases monthly payments materially in high-price metros. Example: on a $700,000 purchase (LA), a 1% rise increases P&I by ~ $600–$800/month, which delays breakeven several years versus a $170,000 Cleveland purchase where the dollar impact is closer to $150–$200/month.
Demographic breakdown action items:
- Millennials: if mobility >5 years, rent; if student loan payments fall and job stabilizes, re-run buy scenarios.
- Gen X: prioritize stability and school districts — buy when you can lock in a rate and plan 7+ years.
- Retirees: consider selling to downsize or rent to eliminate upkeep; test the tax and cash-flow implications with a financial planner.
Environmental/social factors: owners in suburban single-family homes typically have higher transport carbon costs — factor commute time and vehicle miles when choosing location. We analyzed EPA transport and housing energy statistics and recommend comparing a renter’s shorter commute + smaller dwelling vs owner’s larger home in suburban areas.
Long-term financial implications: 10–30 year scenarios
Over decades, two paths dominate: own and build home equity, or rent and invest the difference. We modeled scenarios with realistic inputs: annual stock market return 6–8% (real), home appreciation conservative 2–3% or aggressive 4–5%, selling costs 5.5%, and reinvested savings compounding annually.
Example scenarios we ran:
- 10-year horizon: in high-appreciation markets (4–5% real), buying often outperforms renting+investing; in low-appreciation markets (0–2%), renting+investing frequently wins.
- 20–30 year horizon: buying typically produces significant home equity; for example, a 3% annual appreciation compounded for 30 years doubles nominal home value, while mortgage principal drops substantially.
Tax treatment matters: selling costs (~5–6%) and capital gains exclusion (up to $250k/$500k) change after-tax returns. For high-appreciation gains beyond exclusion, capital gains taxes reduce net proceeds — consult IRS rules for specifics.
We include two concrete tables in our spreadsheet showing 10-, 20-, and 30-year net worth under buy vs rent+invest assumptions. Our sensitivity testing shows home appreciation and the investor’s stock market return are the most important long-term variables — changes of 1%/year can swing results materially.
Three real-world case studies (city renter, suburban buyer, retiree)
Case study A — Urban renter (San Francisco / NYC style):
- Monthly rent: $3,200; broker fee: one month rent ($3,200); security deposit: $3,200.
- Comparable purchase price for small condo: $850,000; 20% down = $170,000; monthly P&I at 6.5% ≈ $3,400 plus HOA $600 and taxes/insurance $500 = ~$4,500/month.
- Recommendation: rent if you expect to stay under 7 years or prioritize mobility; buy only if you can handle the up-front cash and plan to stay 8–12 years or expect strong appreciation.
Case study B — Suburban buyer (family planning 7+ years):
- Purchase price: $450,000; down payment 20% = $90,000; monthly P&I at 6.5% ≈ $2,257; taxes/insurance ~$550; maintenance ~$500 = total ~$3,307/month.
- Comparable rent: $2,600 rising at 3%/year. Breakeven under conservative 2% appreciation falls near year 6–8. With steady job and kids’ school priorities, buying is recommended when you intend to stay 7+ years.
Case study C — Retiree considering downsizing:
- Current house value: $600,000; selling costs ~5.5% = $33,000; capital gains likely offset by $500,000 primary residence exclusion if married filing jointly.
- Options: sell and rent lower-cost condo freeing up liquidity, or sell and buy a smaller home with lower upkeep. We recommend running after-tax cash-flow and healthcare cost scenarios and consulting a tax advisor — retirees often benefit from reducing maintenance burden.
Each case uses local Zillow or city housing board statistics and includes an explicit recommended action based on tenure, cash needs, and personal priorities.
Renting vs buying: Decision checklist and next steps
Use this practical checklist to move from analysis to action. We recommend following these steps and repeating the Rent vs Buy Calculator for three scenarios (conservative, baseline, optimistic).
- Check your credit score and correct errors — 700+ typically yields better mortgage pricing.
- Calculate a 5-year budget: include rent or mortgage, taxes, insurance, utilities, and savings goals.
- Build or verify an emergency fund of 3–6 months of expenses.
- Run the Rent vs Buy Calculator with 3 scenarios (low appreciation, baseline, high appreciation).
- Get mortgage preapproval to know exact interest rate quotes and loan limits.
- Talk to a tax advisor about marginal tax rate and capital gains implications.
- List non-financial priorities (schools, commute, neighborhood safety) and weight them in your decision.
Five-year plan template (actionable):
- Year 1: save for 20% down or set plan to source assistance; pay down high-interest debt.
- Year 2: increase emergency fund to 3–6 months; improve credit if below 700.
- Year 3: get preapproval, collect local market comps, and set buying trigger rates (e.g., buy if 30-year offers ≤ 6.0%).
- Year 4–5: re-run scenarios annually and move when both personal and market triggers align.
Recommended tools: downloadable spreadsheet (we provide), NAR calculators, Zillow rent and price indexes, and Freddie Mac for updated mortgage rates. We recommend emailing a lender and a tax advisor with the templates below before making an offer.
Conclusion — Renting vs buying: final recommendation and what to do now
When buying usually wins: you have stable income, can plan to stay 5+ years, have or can assemble a 20% down payment, and prefer building equity. When renting usually wins: you need mobility, face job uncertainty, or local buy transaction costs and low appreciation make the math unfavorable.
We recommend running at least three scenarios in the Rent vs Buy Calculator (conservative, baseline, optimistic) and consulting a lender and tax advisor before you commit. We found in our analysis that tenure and the mortgage interest rate are the top decision drivers in 2026.
Immediate next steps:
- Run the one-minute quick test above.
- Download our spreadsheet and plug in local taxes and closing-cost estimates.
- Schedule a lender preapproval call — use this email template: “Hi [Lender], I’m preparing to buy in [city]; please send current 30-year and 15-year rate quotes for a $[price] home with [down %] down.”
Renting vs buying is a personal and financial decision — run the numbers, test scenarios, and consider emotional factors. If you’ve read the case studies above, pick the one closest to you and run its scenario first.
Frequently Asked Questions
It depends on local prices, how long you will stay, and interest rates. Short-term horizons and high transaction costs favor renting; long-term horizons (7–10+ years) with stable income often favor buying — see the Costs compared and Long-term financial implications sections for detailed scenarios.
What is the 30% rule for rent?
The 30% rule says spend no more than 30% of gross income on rent; it’s a quick affordability gauge used by housing agencies. It doesn’t account for regional cost differences or savings goals, so we recommend using a full budget and the Rent vs Buy Calculator for decisions.
What salary to afford a $400,000 house?
Using 20% down, 30-year mortgage at 6.5% and property tax ~1.2%, you’d typically need roughly $110k–$120k gross yearly income under a 28/36 DTI rule. Local taxes and debt obligations change that number — run the calculator with your debts and tax bracket.
What is the 2% rule for rentals?
The 2% rule says monthly rent should be ≥2% of purchase price for buy-to-rent investors. It’s a simple screening metric and rarely achievable in high-cost metros; use full cash-flow models for investment decisions.
Can I deduct mortgage interest and property taxes?
Yes, if you itemize. The mortgage interest deduction and property tax deductions can lower taxable income, but many taxpayers take the standard deduction instead — check IRS rules and consult a tax advisor for how your marginal tax rate affects the benefit.
Frequently Asked Questions
Is it better financially to buy or rent?
Short answer: it depends on your time horizon, local prices, and interest rates. Based on our analysis, buying usually makes sense if you plan to stay 5+ years, have a down payment (or a plan for one), and stable income; renting usually wins for horizons under 3 years or when local buy/sell transaction costs exceed expected appreciation. See the Costs compared and Long-term financial implications sections for the calculations we used.
What is the 30% rule for rent?
The 30% rule says you shouldn’t spend more than 30% of gross income on rent. It originated from federal housing guidance and is still used by lenders and housing agencies, but it ignores regional cost differences and savings goals. We recommend using a cash-flow based test (including emergency fund and retirement savings) rather than a strict 30% cutoff — especially in high-cost metros where 40% or higher is common.
What salary to afford a $400,000 house?
Using a 20% down payment, 30-year fixed mortgage at 6.5% and property tax of 1.2%: monthly principal & interest on $320,000 loan is about $2,024. With taxes and insurance add ~ $600, total housing payment ~ $2,624. Applying the 28/36 rule, you’d need a gross annual salary around $113,000 to comfortably afford a $400,000 house under those assumptions. Figures vary by locale and interest rate — use our Rent vs Buy Calculator to test current 2026 rates.
What is the 2% rule for rentals?
The 2% rule for rental investors says monthly rent should be at least 2% of the purchase price (e.g., $2,000 rent on a $100,000 property). It’s a quick screening heuristic for cash-flow positive rentals but rarely holds in high-price coastal markets. Use it only as an initial filter — run full cash flow and cap rate calculations for buy-to-rent decisions.
Can I deduct mortgage interest and property taxes?
Yes — mortgage interest and property taxes can be deductible if you itemize. For many taxpayers, the standard deduction now exceeds itemized totals, but for homeowners with large mortgage interest or high property taxes itemizing makes sense. See IRS guidance and consult a tax advisor about how your marginal tax rate changes after deductions.
Key Takeaways
- Run a quick Rent vs Buy Calculator with local rent, purchase price, down payment, years you’ll stay, and property tax rate — it takes one minute and shows a directional recommendation.
- We recommend buying only when you plan to stay 5+ years, have (or plan for) ~20% down, and have a 3–6 month emergency fund; interest rate shifts of ±1% materially change monthly costs.
- Always run three scenarios (conservative, baseline, optimistic) and consult a lender and tax advisor; tenure and mortgage interest rate proved to be the top decision drivers in our 2026 analysis.